Geriatric Viz
Reddit is a beautiful platform where you can connect with people with similar interests by subsribing to, what is called a subreddit, the community. On such community is r/dataisbeautiful (r/ references a subreddit) where people from data science community post interesting (and sometimes funny) visualiztion using tools like D3.js, matplotlib, Bokeh, Tableau and many more.
This beautiful subreddit also hosts a monthly visualization competition by providing a small dataset. This month the admins of subreddit have posted a data that contains a list of oldest people and various attributes. I’ve cleaned the dataset as per my requirements and can be accessed here.
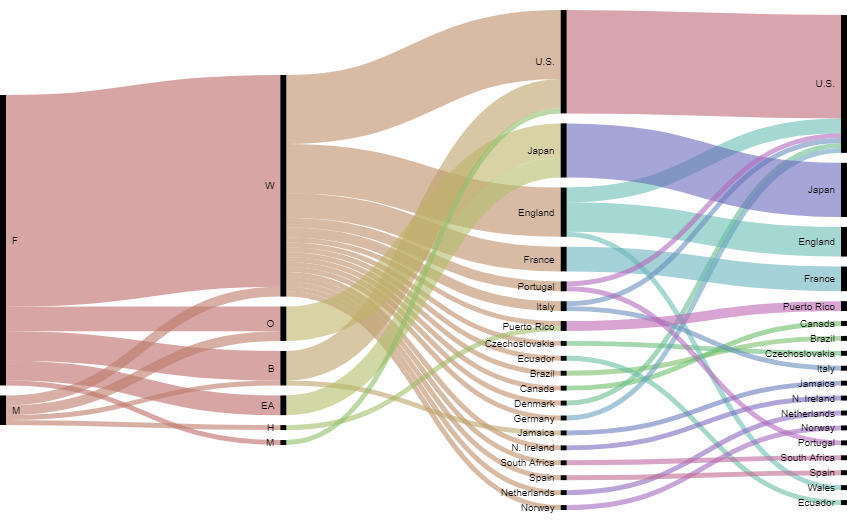
I’ve tried to visualize the relationship between gender, ethnicity and birthplace and deathplace using Raw Graphs open source project.

So from the visualization, so far the oldest people in the world have been white women from United States. Cheers
