

Anomaly Detection in Claims Submission Process
Agenda of this post is:
- Business Problem Overview
- Summary of Model Output
- Factspan’s Approach Framework
- Key Challenges in the recommended approach
- Exploratory Data Analysis
- Anomaly Detection Algorithm Development
- Risk Assessment Framework
- Isolation Forest overview
- Python Implementation Demo
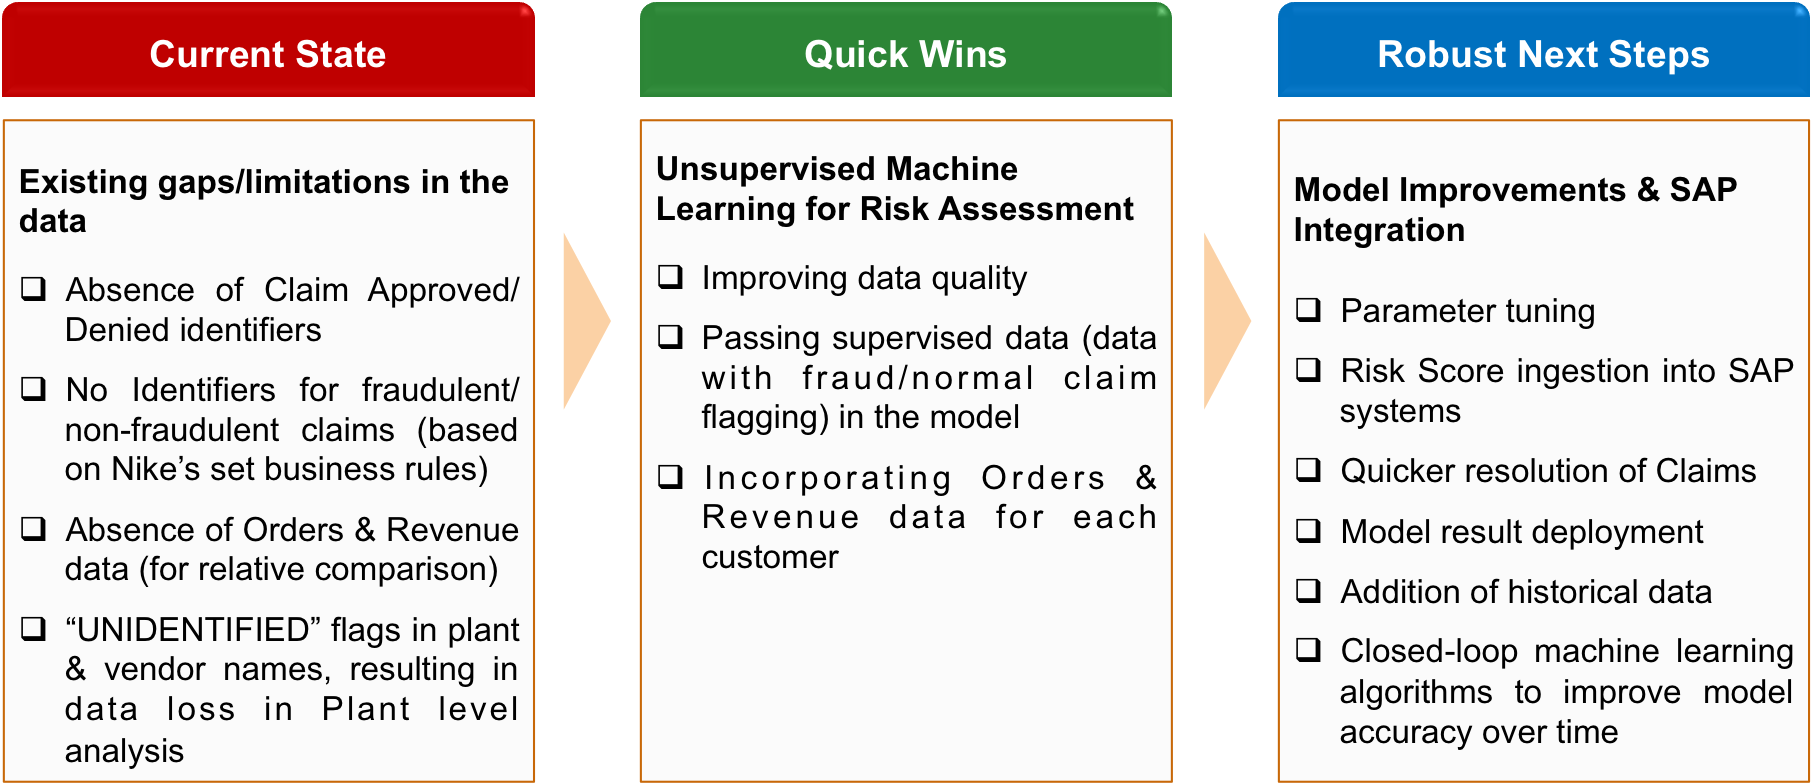
- Long Term Vision
Business Problem Overview:
Current State
- Client maintains order-to-cash claims data in SAP system
- They scrutinize every claim that are filed by different customers to manually identify fraudulent cases
- Manual effort lead to:
- Longer processing time
- Less time for analysis and accurate decision making
Problem Statement
- Build a risk assessement and scoring model which would help identify the anomalous claims
Desired State
- Client is able to detect the anomaly quickly
- Client is able to manage the data in SAP for each claim with risk score
- Based on the risk scores, the team is able to prioritize the high risk claims which will enable them to
- Act pro-active, fast and close the claims quickly
- Identify opportunities for recoverability and reduce dollars adjustment towards fraudulent claims
Summary of Model Output
Implementing Factspan’s anomaly detection algorithm can help Client prioritize high risk claims worth $45.2 Million for investigation
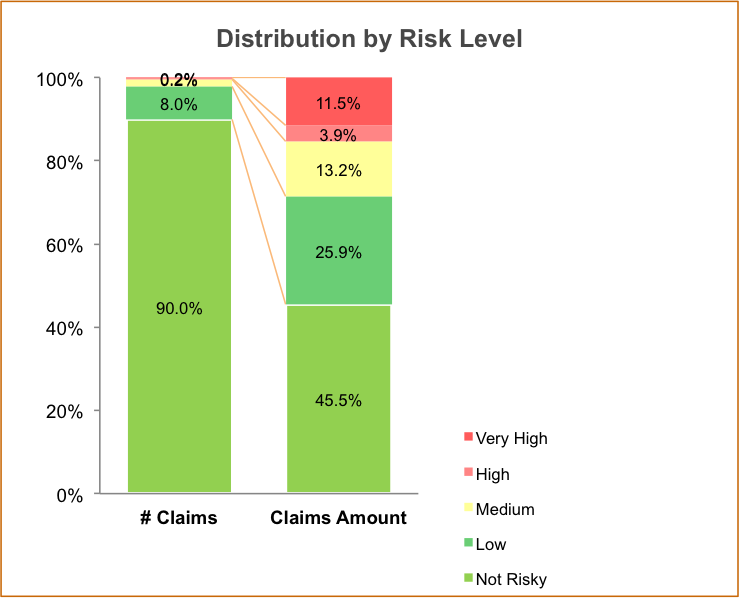
YoY Comparison at overall level
* The high risk claims (VH + H) account for 0.4% of total claims, but result in around 15% of total claim amount filed for
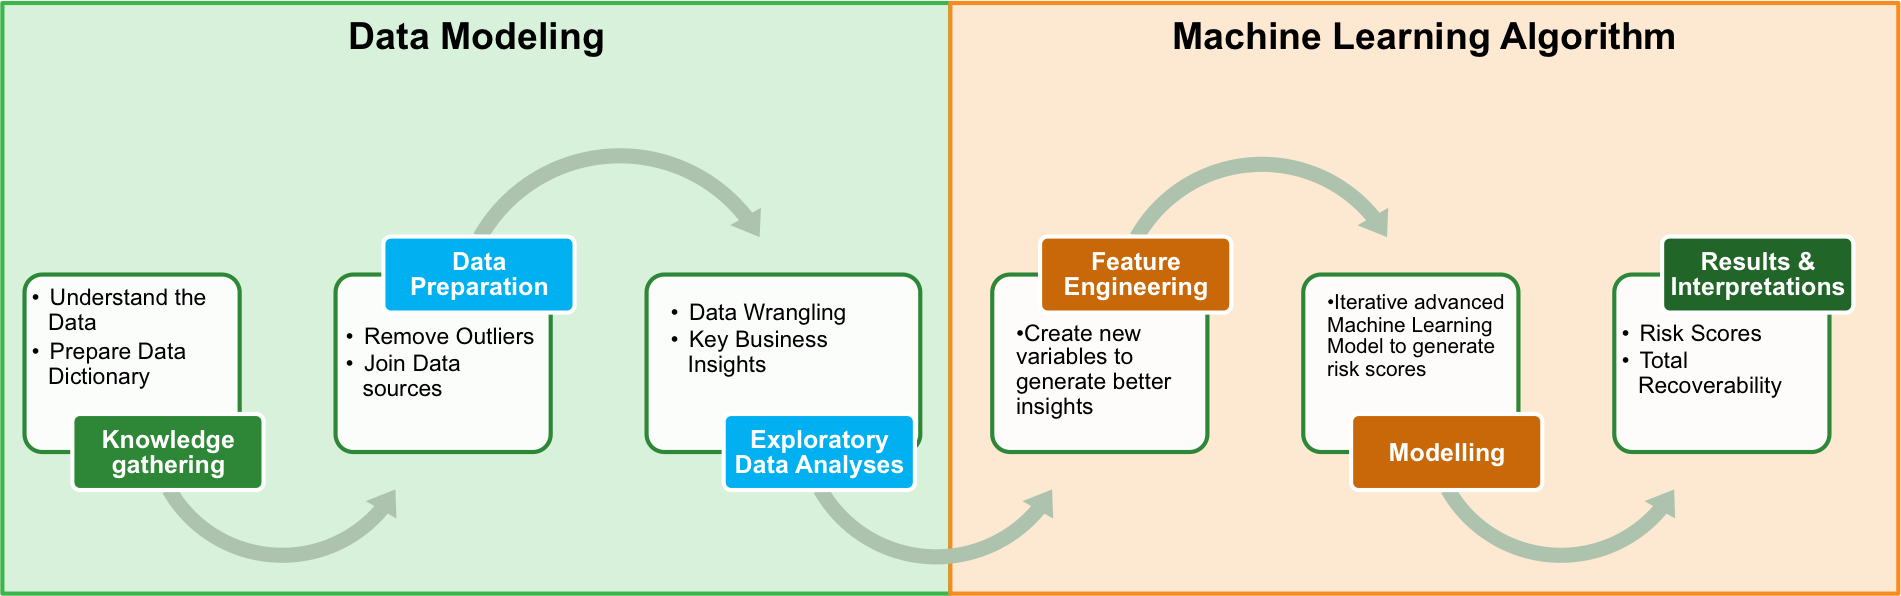
Factspan’s Step-by-Step Approach to Machine learning
Key Challenges
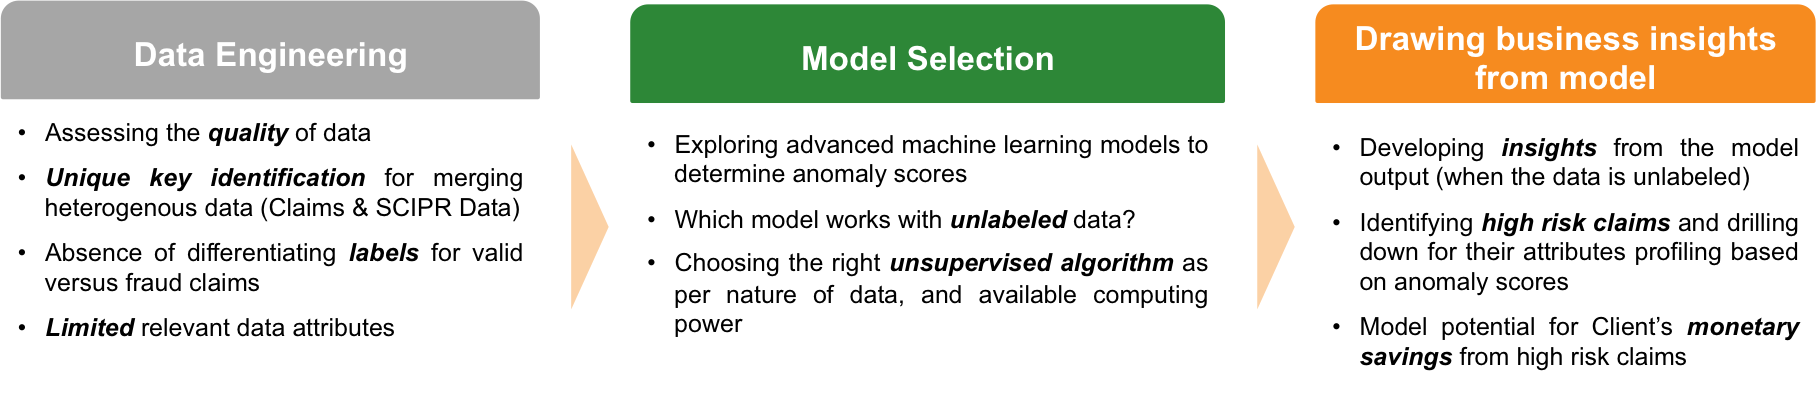 ___
___
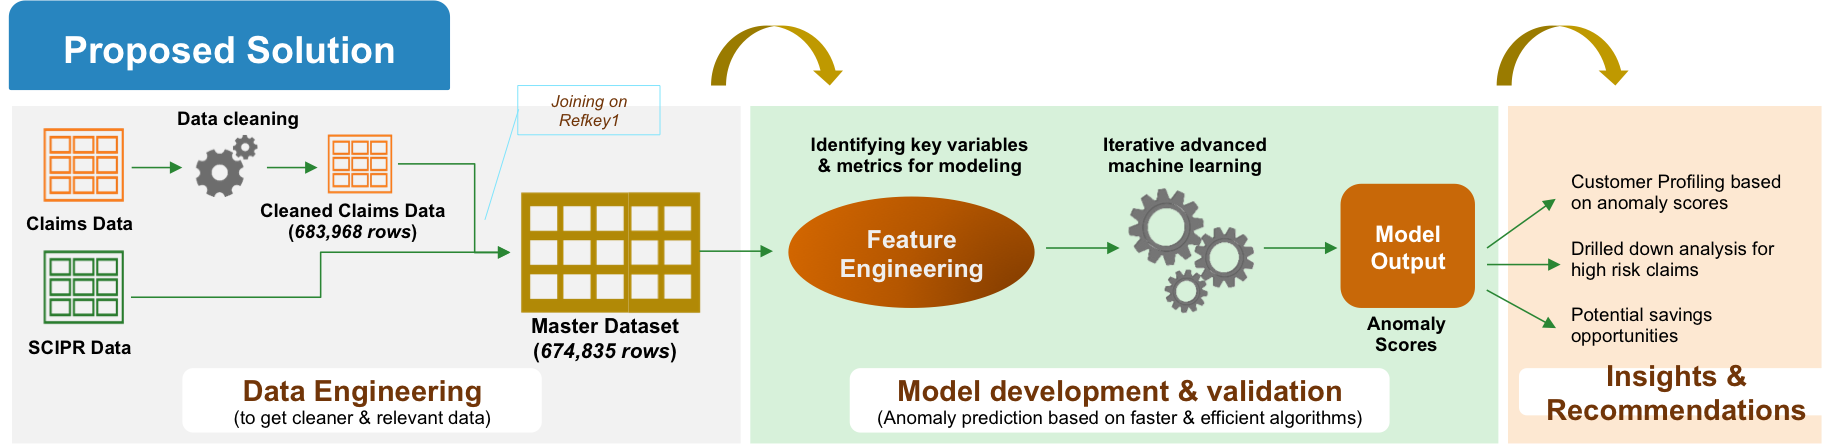
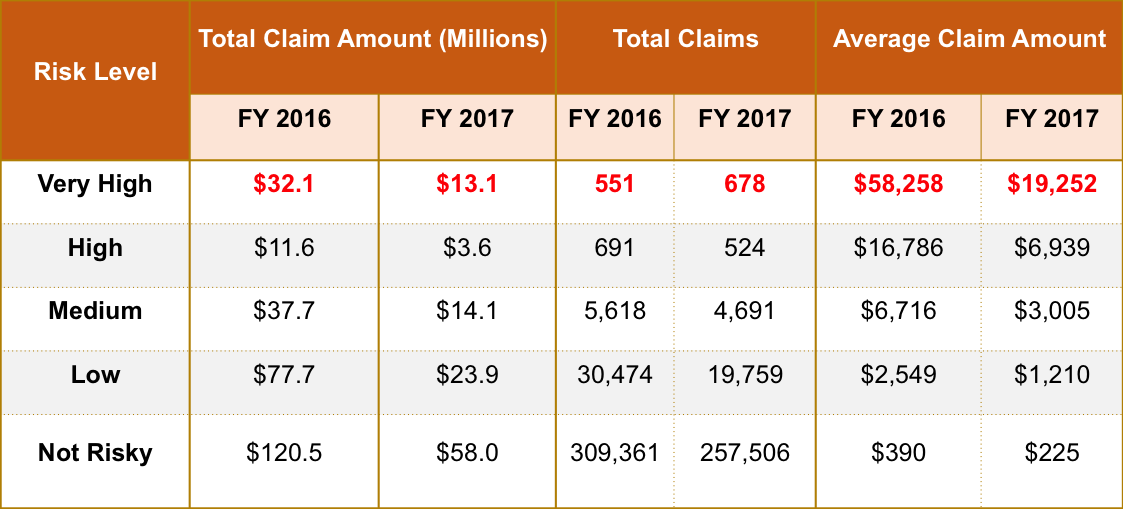
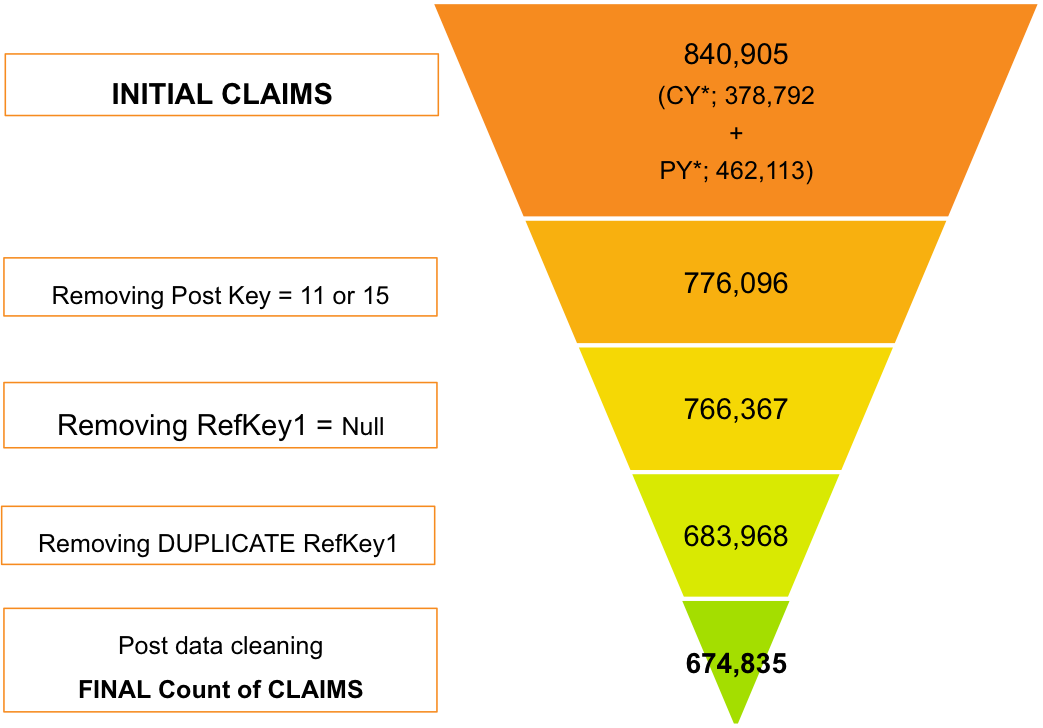
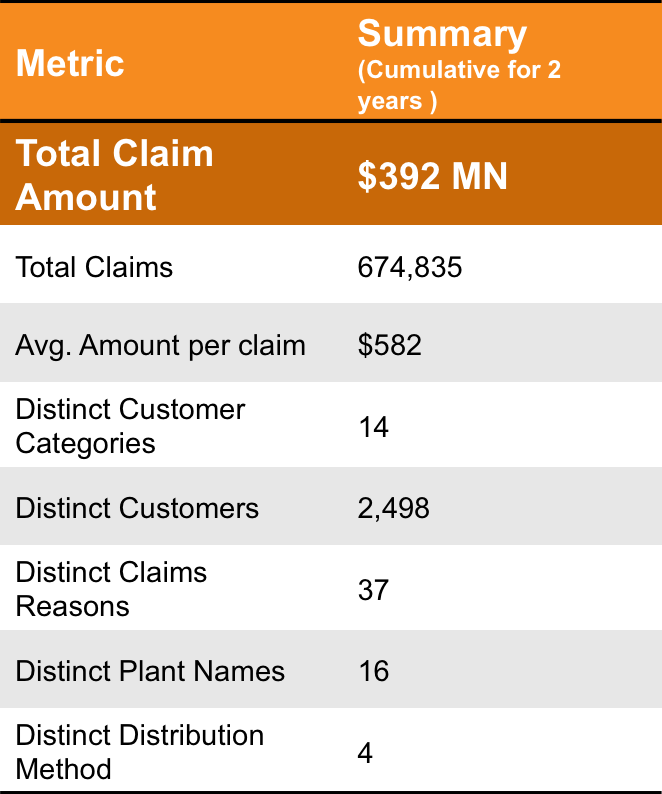
Initial Data cleaning and processing resulted in ~670k records for modelling
High YoY drop in Total Claims, Claim Amt, Avg. Amt per claim
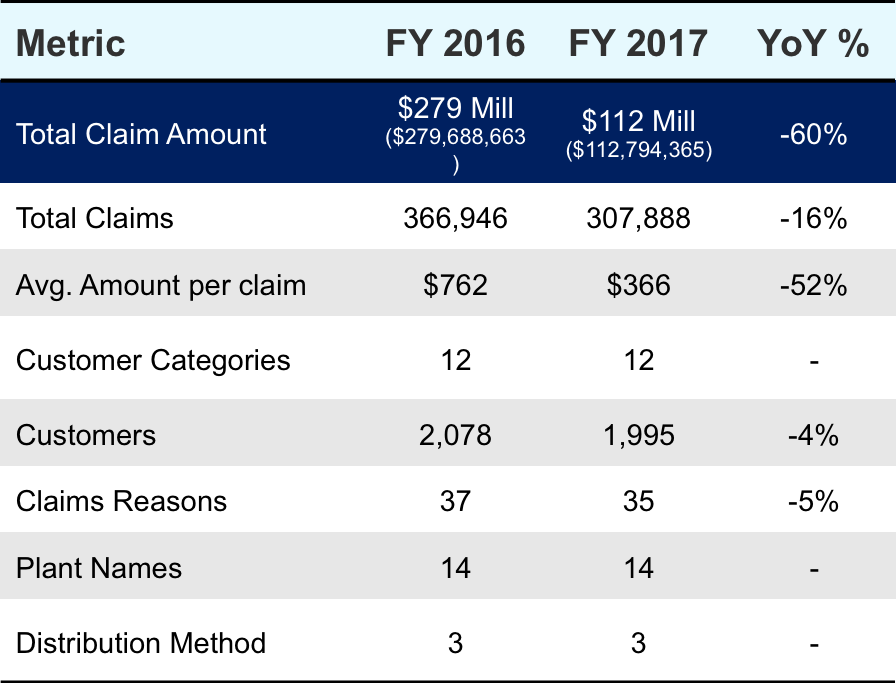
- There is a substantial drop in total claim amount YoY with 60% drop in total claim amount and 16% drop in Total Claims & 52% in Avg. Claim amount
- There are 4% lesser customers and 5% lesser distinct reasons for the claims filed in FY 2017 v/s FY 2016
Anomaly Detection Model Development
Risk Assesment Framework
Objective of the Machine Learning model is to determine potential risk of a claim being fraudulent understand its key drivers, and estimate the monetary value attached to such fraudelent claims
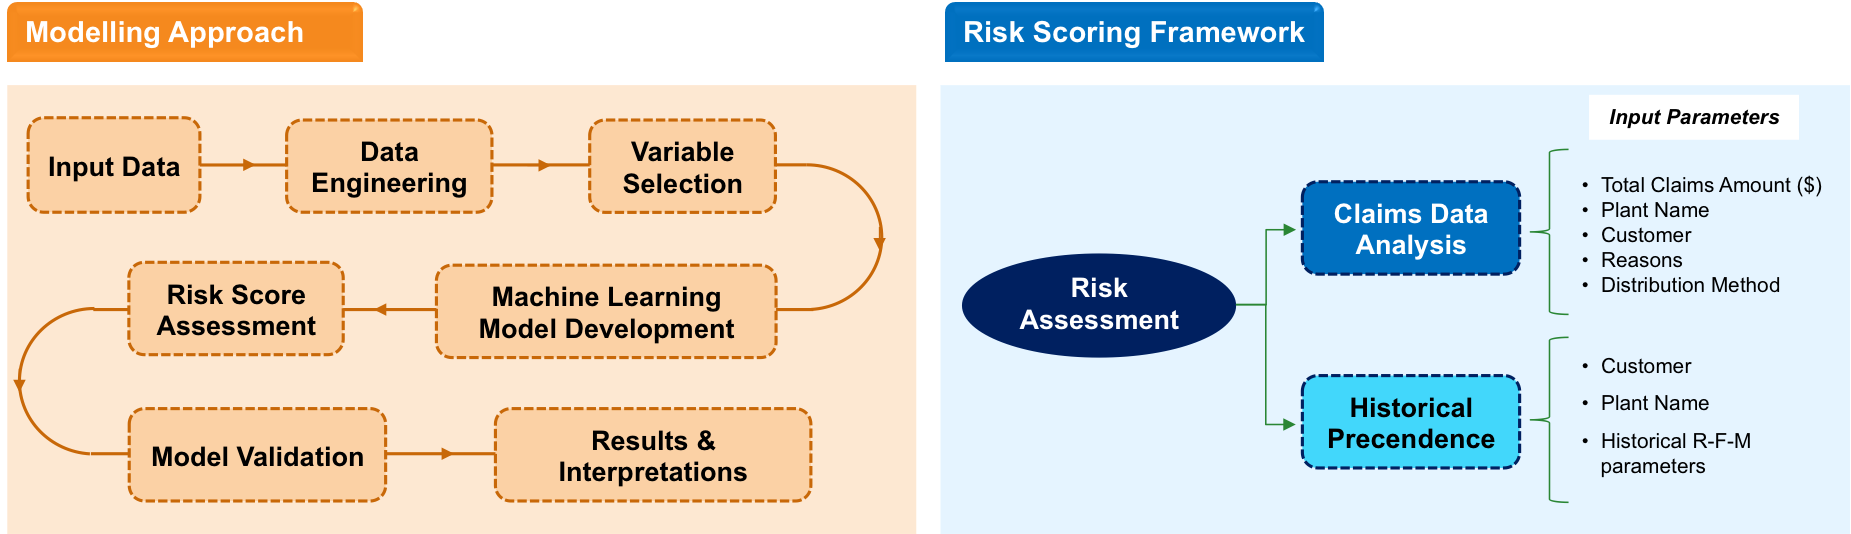
The unsupervised Machine Learning model identifies anomalous claims, and returns a risk score against each claim, that can be further drilled down to identify key factors behind high risk claims, and its business impact
Isolation Forest Overview
Isolation Forest isolates observations by randomly selecting a feature (variable) and then randomly selecting a split of the selected feature, till all the instances are covered and lie in their own seperate node, hence growing a decision tree.

Key Feature
- Does not require distance or density measures to detect anomalies
- Is a proper binary tree
- Underlying assumption - Isolating anomaly observations is easier, as only few conditions are needed to separate abnormal cases from the normal ones
- Has linear time complexity, and low memory requirements
- Capability to scale up to handle extremely large data, and high-dimensional problems
Isolation Forest Python Demo
Isolation forest is implemented in various libraries but using sci-kit learn APIs makes life easier and it integrates really well with Pandas API and Numpy API
folder ='D:/Data/Modelling Data/'
Libraries to include
- Pandas and Numpy for handling data in a faster and efficient way
- Matplotlib for Graphing
- Sklearn for using machine learning implementations in python
import pandas as pd
import numpy as np
import time as time
from sklearn import preprocessing
from sklearn.ensemble import IsolationForest
%matplotlib inline
Importing the data using Pandas API
data = pd.read_csv(folder+'input_data1.csv')
Checking for missing values
data.isnull().sum()
SoldToCustomer           0
RefKey1                  0
TotalClaims              0
RsnCodeDesc              0
Category              4253
PlntNm                   0
DistribMthdCd            0
Frequency_Customer       0
RunTot_Customer          0
AvgRunTot_Cust           0
recency_Customer         0
Frequency_Plant          0
RunTot_Plant             0
AvgRunTot_Plant          0
Frequency_Rsn            0
RunTot_Rsn               0
AvgRunTot_Rsn            0
dtype: int64
Category has around 4253 Missing values of ~670k records
Imputing Missing values with a new category called Unknown
feature = ['Category']
for feature in feature:
    data[feature] = data[feature].fillna('Unknown')
print(data.isnull().sum())
SoldToCustomer        0
RefKey1               0
TotalClaims           0
RsnCodeDesc           0
Category              0
PlntNm                0
DistribMthdCd         0
Frequency_Customer    0
RunTot_Customer       0
AvgRunTot_Cust        0
recency_Customer      0
Frequency_Plant       0
RunTot_Plant          0
AvgRunTot_Plant       0
Frequency_Rsn         0
RunTot_Rsn            0
AvgRunTot_Rsn         0
dtype: int64
Using sklearn’s preprocessing API we encode the features of the categorical variables. We need to do this because sklearn’s machine learning API doesn’t support strings as inputs.
from sklearn import preprocessing
def encode_features(df_train):
    features = ['SoldToCustomer','RsnCodeDesc', 'Category','PlntNm', 'DistribMthdCd']

    for feature in features:
        le = preprocessing.LabelEncoder()
        le = le.fit(df_train[feature])
        df_train[feature] = le.transform(df_train[feature])
    return df_train
st = time.time()
data = encode_features(data)
print(time.time()-st)
6.7506749629974365
We initate the SKlearn’s implementation of Isolation forest.
- n_estimators -> Number of isolation trees to grow
- max_samples -> proporation of total data to be included in each isolation trees
- n_jobs -> multithreading the algorithm
#Initiating the Algorithm
from sklearn.ensemble import IsolationForest
clust = IsolationForest(n_estimators = 100, max_samples = 0.5, n_jobs = -1, random_state = 23,verbose = 1, bootstrap = False)
we drop take a copy of keys and store it in seperate variable and drop it from the dataset since it isn’t a feature on which model will learn to detect anomalies
#Preparing Data
key = data['RefKey1']
X = data.drop(['RefKey1'], axis = 1)
try: del data
except: pass
#Fitting the Model
st = time.time()
clust.fit(X)
print("time to fit model: {} s" .format(time.time()-st))
[Parallel(n_jobs=4)]: Done   2 out of   4 | elapsed:   13.0s remaining:   13.0s
[Parallel(n_jobs=4)]: Done   4 out of   4 | elapsed:   13.5s finished


time to fit model: 47.278727293014526 s
#Predicting the Anomalies and score
st = time.time()
Y =clust.predict(X)
Y_score = clust.decision_function(X)
print("time to make prediction: {} s" .format(time.time()-st))
time to make prediction: 65.0640001296997 s
#Outputing the Fil as a csv
Y = pd.DataFrame({'Claim ID':key,'Anomaly':Y, 'Risk_Score':Y_score})
Y.to_csv(folder+'Anomaly.csv', sep = ',')
Long term vision for Client’s claim settlement process to maximize the utilization of Advanced Machine Learning algorithms
Original Post can be found here